
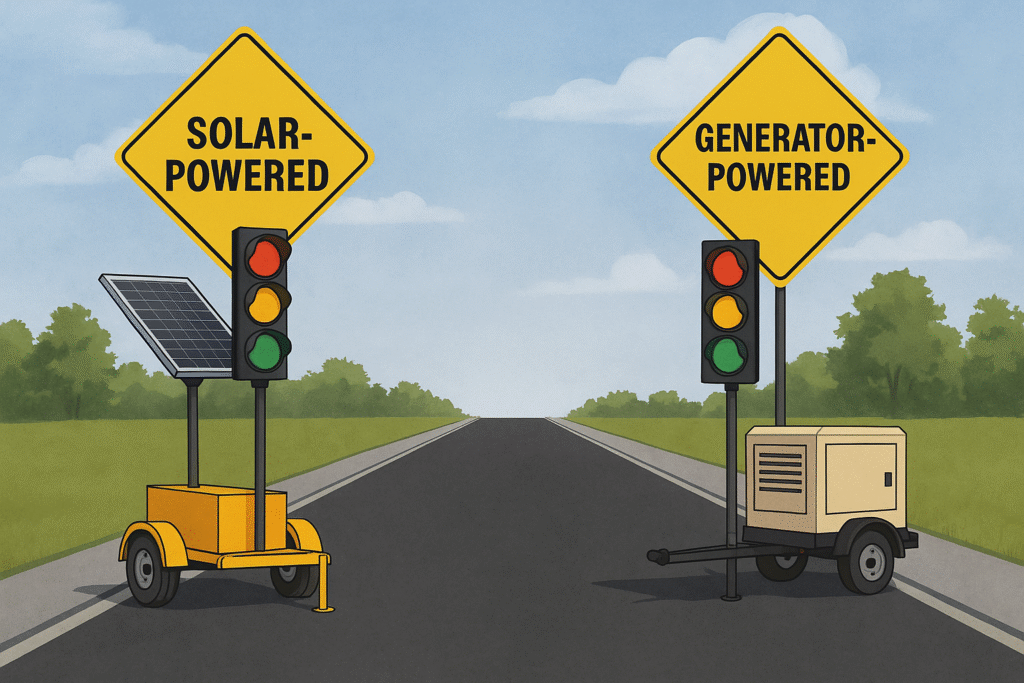
Cost Comparison Traffic Control: Start Here
Cities, DOTs, and contractors increasingly ask one practical question: which temporary traffic control setup costs less over the life of a project—solar or generator? This cost comparison traffic control guide breaks down the factors that drive total cost of ownership (TCO): fuel, labor, maintenance, reliability, community impact, and scalability. Use it to align budgets with safety and sustainability goals.
Table of Contents
Quick Takeaways
- Fuel drives cost for generators; solar eliminates fuel and stabilizes budgets.
- Labor hours (refueling, inspections) are material with generators; solar systems minimize daily site visits.
- Reliability improves with solar + batteries; less unplanned downtime and fewer public complaints.
- ROI for frequently deployed systems is typically fast because fuel and labor savings compound.
- Community benefits: solar is quiet, clean, and often easier to permit near sensitive areas.
How We Compare Costs
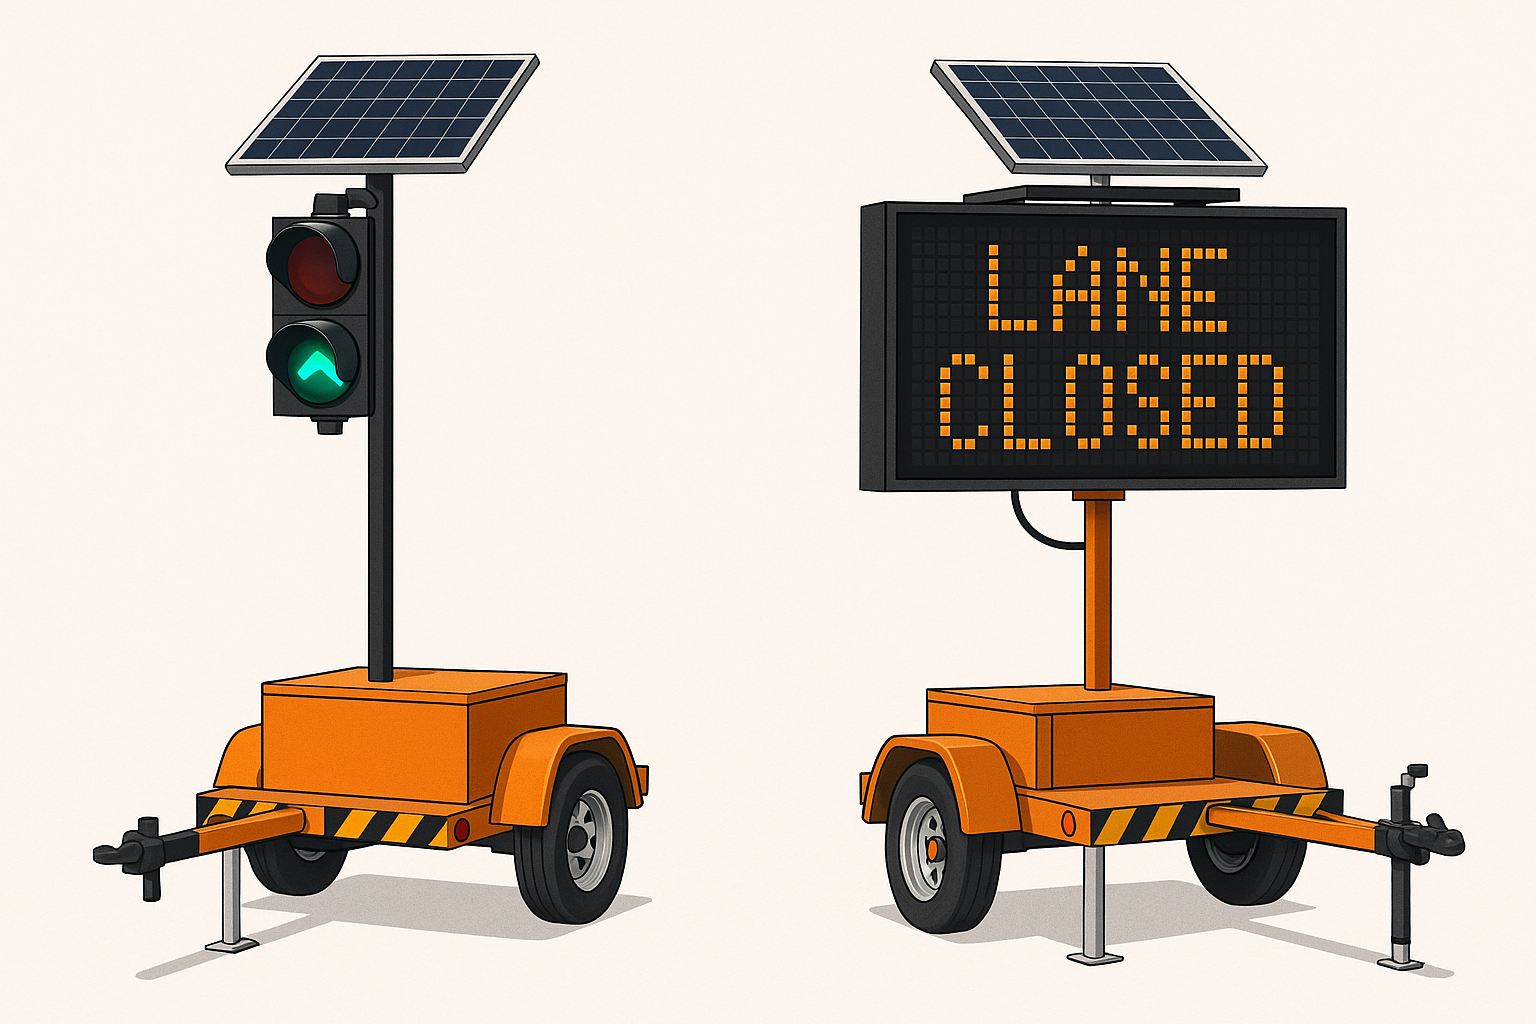
This guide evaluates portable traffic signals and temporary intersection/ lane‑closure systems powered by either:
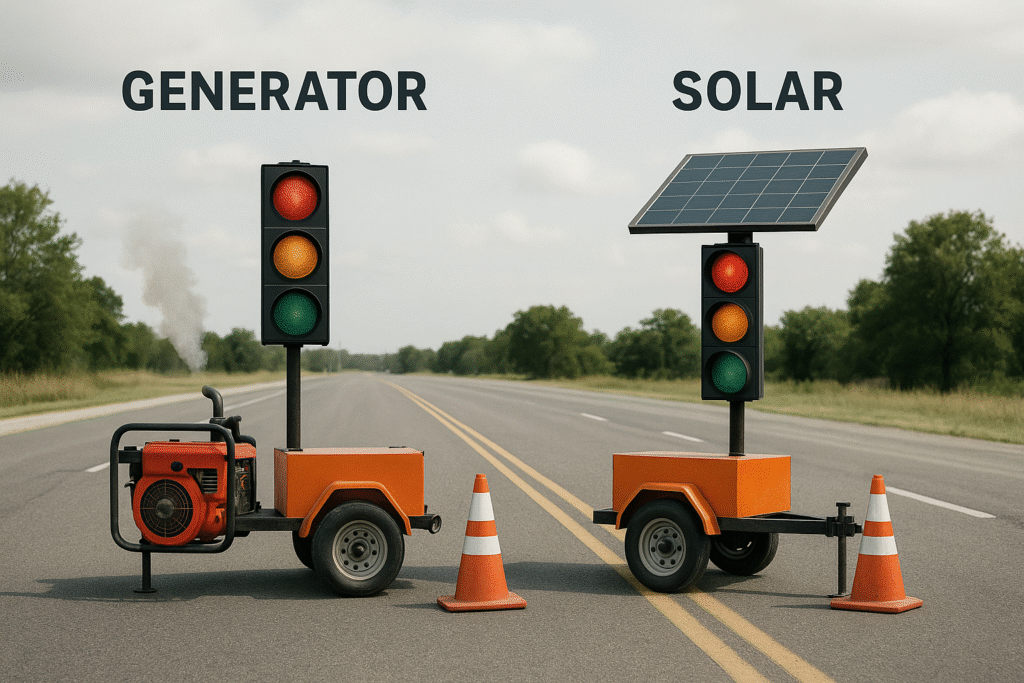
- Diesel/petrol generator units, or
- Solar arrays with battery storage (often with remote telemetry).
We consider direct costs (fuel, labor, maintenance) and indirect costs (downtime risk, complaints, emissions, and noise).
Side‑by‑Side Cost Comparison
| Cost / Impact AreaSolar‑Powered Traffic ControlGenerator‑Powered Traffic Control | ||
|---|---|---|
| Fuel / Energy | $0 fuel; predictable energy budget | Ongoing diesel/petrol expense; price volatility |
| Daily Labor | Minimal visits; remote checks | Refueling + inspections; more truck rolls |
| Maintenance | Fewer moving parts; longer service intervals | Filters, oil changes, plugs; higher wear |
| Downtime Risk | Battery autonomy + solar recovery | Fuel-outs, mechanical faults, weather sensitivity |
| Upfront Cost | Higher in many cases | Lower initial outlay |
| ROI | Savings from fuel + labor can offset quickly | Costs scale with hours used |
| Noise | Silent operation | Noticeable generator noise; mitigation may be needed |
| Emissions | Zero operating emissions | Tailpipe emissions; may affect permits/funding |
| Durability | Solid-state electronics; weatherized | Vibration & engine wear over long runtimes |
| Remote Access | Common (telematics, alerts, SOC) | Often absent or add‑on |
| Scalability | Easy to duplicate across sites | Logistics multiply (fuel, staffing) |
Fuel Efficiency & Energy Costs
Fuel is the largest recurring cost in generator setups. Continuous or extended runtime (e.g., 24/7 lane closures) can push fuel consumption—and budget exposure—up quickly. Solar systems remove fuel entirely, eliminating both cost and volatility, and simplifying forecasting.
Labor & Daily Maintenance
Generator systems require regular refueling and checks. Each site visit consumes labor, a vehicle, and time—especially across multiple work zones. Solar systems typically require far fewer site visits, with performance verified via telemetry. Over a month, reallocated labor translates into significant savings and smoother operations.
Downtime & Reliability
Unplanned downtime triggers safety risks and complaints. Generators are vulnerable to fuel-outs, mechanical failures, and weather. Solar systems paired with batteries are built for autonomy: multi‑day storage and automatic solar recovery reduce interruptions and callouts.
Upfront Cost & ROI
Solar sometimes carries a higher initial investment than a small generator. However, if your utilization is high (long shifts, multi‑week deployments, frequent redeployments), fuel + labor savings create a strong payback window. For many agencies, the total cost of ownership of solar becomes lower in the first season of heavy use.
ROI rule of thumb: If monthly savings from avoided fuel + labor exceed the solar price premium, your break‑even occurs within that month count.
Environmental & Community Impact
- Emissions: Solar operates with zero tailpipe emissions, aligning with sustainability goals and potential funding criteria.
- Noise: Solar is near‑silent, minimizing complaints near homes, schools, hospitals, and downtown business districts.
Lifespan & Durability
Solar systems feature solid‑state components, sealed enclosures, and long‑life batteries. Generators involve combustion engines that wear with runtime and vibration, increasing part replacements and service events over their life.
Remote Monitoring & Control
Modern solar platforms commonly include cloud dashboards and alerts (battery state, panel performance, door open, tilt, location). That visibility enables proactive maintenance, reducing surprises and truck rolls.
Scaling to Multi‑Site Projects
With generators, every new site adds fuel logistics and staffing. Solar scales differently: once deployed, each unit is largely autonomous, and you leverage the same telemetry environment for all sites.
Worked Example: 30‑Day Project Costs
Illustrative only. Use your actual fuel rate, labor rate, and equipment specs.
Scenario: Two portable signals, 24/7 for 30 days.
Assumptions (Generator):
- Consumption per unit: 0.5 gal/hour
- Hours/day: 24
- Gallons/day per unit: 0.5 × 24 = 12
- Two units → total gallons/day: 12 × 2 = 24
- Duration: 30 days → total gallons: 24 × 30 = 720 gal
- Diesel cost (example): $4.25/gal
- Fuel cost: 720 × $4.25 = (700 × 4.25 = $2,975) + (20 × 4.25 = $85) = $3,060
- Daily labor for refuel/inspection: 1 hr/day × 30 days × $65/hr = $1,950
- Maintenance (oil, filters, minor service over 720 engine hours, est.): $600
- 30‑day generator OPEX (fuel + labor + maint.): $3,060 + $1,950 + $600 = $5,610
Assumptions (Solar):
- Fuel: $0
- Remote checks: 10 min/day = 0.1667 hr/day × 30 = 5 hrs × $65/hr = $325
- Minor maintenance allowance: $100
- 30‑day solar OPEX: $325 + $100 = $425
Illustrative 30‑day savings: $5,610 − $425 = $5,185
If the solar option’s monthly price premium is less than $5,185, your break‑even is < 1 month in this scenario.
When to Choose Solar vs. Generator
Choose Solar when:
- Projects run long hours or multi‑week durations.
- Sites are urban/noise‑sensitive or have sustainability mandates.
- You need remote visibility and fewer site visits.
- You manage multiple concurrent work zones.
Choose Generator when:
- The deployment is very short and logistics for solar delivery don’t pencil out.
- The site is heavily shaded and you cannot reposition arrays.
- You already have ample generator inventory for a brief, low‑risk task.
Specification Checklist
Include these items in your bid/spec to control cost and performance:
- Power Platform: solar array size (W), battery capacity (Ah/kWh), target autonomy (days).
- Telemetry: remote SOC%, location, alerts, reporting.
- Duty Cycle: hours/day, expected peak loads, seasonal conditions.
- Safety/Performance: MUTCD/ITE compliance, light intensity, visibility.
- Service: warranty terms, response times, preventive maintenance plan.
- Logistics: delivery, setup, and training; anchoring and anti‑theft.
- Data & Security: user roles, audit logs, data retention.
- Sustainability: emissions goals, noise requirements, grant alignment.
FAQs
Q1. Is solar reliable in cloudy or winter conditions?
Most commercial solar traffic systems pair panels with multi‑day battery autonomy. Proper panel placement, periodic cleaning, and right‑sizing the array keep uptime high.
Q2. What if the location is shaded?
Where shade is unavoidable, consider panel repositioning, higher‑capacity batteries, hybrid charging, or—if none are feasible—a short‑term generator for that site.
Q3. How do I estimate ROI for solar?
Add your monthly generator fuel + labor + maintenance costs. Compare that total to the solar monthly cost (or ownership cost). If solar’s premium is lower than the savings, the break‑even is within that many months.
Q4. Do solar systems require daily site visits?
Typically no. With telemetry, daily checks are remote. Field visits are usually for placement, cleaning, or scheduled service.
Q5. Are there funding or sustainability advantages?
Agencies pursuing emissions and noise reduction targets often find solar helps meet policy commitments and can support applications for green infrastructure funding.
Conclusion & Next Steps
Across fuel, labor, uptime, and community impact, solar‑powered traffic control provides clear, measurable advantages for most multi‑day deployments. Generators still have a role in short, shaded, or specialized scenarios, but solar’s TCO wins as runtime and number of sites increase.
Modernize with JTI:
- Explore JTI Portable Solar Traffic Signals for lane closures and temporary intersections.
- Add JTI Monitoring & Telematics for real‑time health, alerts, and reporting.
- Talk with JTI about rental vs. purchase and a tailored ROI model for your project portfolio.